Inhaltsverzeichnis
26. EZM World Cup
| Daten & Fakten | |
|---|---|
 |
|
| Saison | 190 |
| Edition | XXVI |
| Gastgeber | png |
| Modus | Gruppenphase & K.O. |
 Gold Gold | png |
 Silber Silber | png |
 Bronze Bronze | png |
| Absteiger | png |
| Aufsteiger | png |
| WC Winning Goal | png |
| WC Hauptseite | ||
| ◄ WC XXV • WC XXVII ► |
Austragungsort
Der Austragungsort wurde direkt über ein Voting im Spiel unter allen Managern beschlossen. Zur Auswahl standen alle A-Nationen die noch nicht Gastgeber eines World Cups waren. Die Wahl fiel auf Österreich  .
.
Spielstätten
- tba (tba, Team ID:0)
- tba (tba, Team ID:0)
Pressestelle
 Jannik (LU Lions)
 fridolin (Warmduscher Rockets)
 NiKiOn (Les Rats de Nancy)
Die Pressemitteilungen werden/sind über den Link der jeweiligen National Teams einsehbar/sein.
Gruppenphase
Gruppe A
 Finnland
 Estland
 USA
Österreich
USA
Österreich
 Großbritannien
 Russland
Slowakei
Frankreich
Russland
Slowakei
Frankreich
Gruppe B
 Kanada
 Deutschland
 Dänemark
 Italien
 Norwegen
Schweiz
Norwegen
Schweiz
 Schweden
 Tschechien
Spielplan
| Spieltag | Gruppe | ——–Team 1——– | ——–Team 2——– | Ergebnis | Match ID |
|---|---|---|---|---|---|
| 0 | A | Finnland |  Ukraine Ukraine | 5 : 1 | Game Report |
| 0 | A | Deutschland | Schweiz | 2 : 3 | Game Report |
| 0 | A | Slowakei | USA | 3 : 5 | Game Report |
| 0 | A | Schweden | Norwegen | 2 : 1 | Game Report |
| 2 | A | Ukraine | Deutschland | 1 : 3 | Game Report |
| 2 | A | USA | Finnland | 3 : 5 | Game Report |
| 2 | A | Schweiz | Schweden | 4 : 5 | Game Report |
| 2 | A | Norwegen | Slowakei | 4 : 1 | Game Report |
| 4 | A | USA | Ukraine | 3 : 2 | Game Report |
| 4 | A | Schweden | Deutschland | 3 : 2 OT | Game Report |
| 4 | A | Finnland | Norwegen | 4 : 2 | Game Report |
| 4 | A | Slowakei | Schweiz | 2 : 3 | Game Report |
| 6 | A | Ukraine | Schweden | 1 : 6 | Game Report |
| 6 | 0 | Norwegen | USA | 3 : 5 | Game Report |
| 6 | A | Deutschland | Slowakei | 1 : 2 OT | Game Report |
| 6 | A | Schweiz | Finnland | 1 : 3 | Game Report |
| 8 | A | Norwegen | Ukraine | 3 : 2 SO | Game Report |
| 8 | A | Slowakei | Schweden | 1 : 5 | Game Report |
| 8 | A | USA | Schweiz | 2 : 3 OT | Game Report |
| 8 | A | Finnland | Deutschland | 3 : 2 | Game Report |
| 10 | A | Ukraine | Slowakei | 6 : 2 | Game Report |
| 10 | A | Schweiz | Norwegen | 2 : 4 | Game Report |
| 10 | A | Schweden | Finnland | 1 : 2 | Game Report |
| 10 | A | Deutschland | USA | 2 : 4 | Game Report |
| 12 | A | Schweiz | Ukraine | 3 : 2 OT | Game Report |
| 12 | A | Finnland | Slowakei | 4 : 2 | Game Report |
| 12 | A | Norwegen | Deutschland | 1 : 3 | Game Report |
| 12 | A | USA | Schweden | 2 : 1 | Game Report |
| Spieltag | Gruppe | ——–Team 1——– | ——–Team 2——– | Ergebnis | Match ID |
|---|---|---|---|---|---|
| 1 | B | Estland | Russland | 4 : 1 | Game Report |
| 1 | B | Kanada | Frankreich | 3 : 4 SO | Game Report |
| 1 | B | Großbritannien | Österreich | 2 : 4 | Game Report |
| 1 | B | Italien | Dänemark | 1 : 2 | Game Report |
| 3 | B | Russland | Kanada | 4 : 3 OT | Game Report |
| 3 | B | Österreich | Estland | 1 : 0 | Game Report |
| 3 | B | Frankreich | Italien | 1 : 0 | Game Report |
| 3 | B | Dänemark | Großbritannien | 3 : 0 | Game Report |
| 5 | B | Österreich | Russland | 4 : 2 | Game Report |
| 5 | B | Italien | Kanada | 3 : 2 | Game Report |
| 5 | B | Estland | Dänemark | 3 : 4 | Game Report |
| 5 | B | Großbritannien | Frankreich | 2 : 6 | Game Report |
| 7 | B | Russland | Italien | 1 : 3 | Game Report |
| 7 | B | Dänemark | Österreich | 2 : 3 | Game Report |
| 7 | B | Kanada | Großbritannien | 1 : 2 | Game Report |
| 7 | B | Frankreich | Estland | 3 : 4 | Game Report |
| 9 | B | Dänemark | Russland | 3 : 2 OT | Game Report |
| 9 | B | Großbritannien | Italien | 2 : 4 | Game Report |
| 9 | B | Österreich | Frankreich | 4 : 3 | Game Report |
| 9 | B | Estland | Kanada | 1 : 2 OT | Game Report |
| 11 | B | Russland | Großbritannien | 3 : 2 SO | Game Report |
| 11 | B | Frankreich | Dänemark | 2 : 3 SO | Game Report |
| 11 | B | Italien | Estland | 3 : 1 | Game Report |
| 11 | B | Kanada | Österreich | 4 : 1 | Game Report |
| 13 | B | Frankreich | Russland | 5 : 3 | Game Report |
| 13 | B | Estland | Großbritannien | 2 : 1 | Game Report |
| 13 | B | Dänemark | Kanada | 3 : 2 SO | Game Report |
| 13 | B | Österreich | Italien | 3 : 2 SO | Game Report |
Abschlusstabelle
Gruppe A
| Platz | ——–Nation——– | Pkt | Tore | Ggt | S3 | S2 | N1 | N0 |
|---|---|---|---|---|---|---|---|---|
| 1 | Finnland | 21 | 26 | 12 | 7 | 0 | 0 | 0 |
| 2 | USA | 16 | 24 | 19 | 5 | 0 | 1 | 1 |
| 3 | Schweden | 14 | 23 | 13 | 4 | 1 | 0 | 2 |
| 4 | Schweiz | 10 | 19 | 20 | 2 | 2 | 0 | 3 |
| 5 | Norwegen | 8 | 18 | 19 | 2 | 1 | 0 | 4 |
| 6 | Deutschland | 8 | 15 | 17 | 2 | 0 | 2 | 3 |
| 7 | Ukraine | 5 | 15 | 25 | 1 | 0 | 2 | 4 |
| 8 | Slowakei | 2 | 13 | 28 | 0 | 1 | 0 | 6 |
Gruppe B
| Platz | ——–Nation——– | Pkt | Tore | Ggt | S3 | S2 | N1 | N0 |
|---|---|---|---|---|---|---|---|---|
| 1 | Österreich | 17 | 20 | 15 | 5 | 1 | 0 | 1 |
| 2 | Dänemark | 15 | 20 | 13 | 3 | 3 | 0 | 1 |
| 3 | Italien | 13 | 16 | 12 | 4 | 0 | 1 | 2 |
| 4 | Frankreich | 12 | 24 | 19 | 3 | 1 | 1 | 2 |
| 5 | Estland | 10 | 15 | 15 | 3 | 0 | 1 | 3 |
| 6 | Kanada | 8 | 17 | 18 | 1 | 1 | 3 | 2 |
| 7 | Russland | 5 | 16 | 24 | 0 | 2 | 1 | 4 |
| 8 | Großbritannien | 4 | 11 | 23 | 1 | 0 | 1 | 5 |
Endrunde
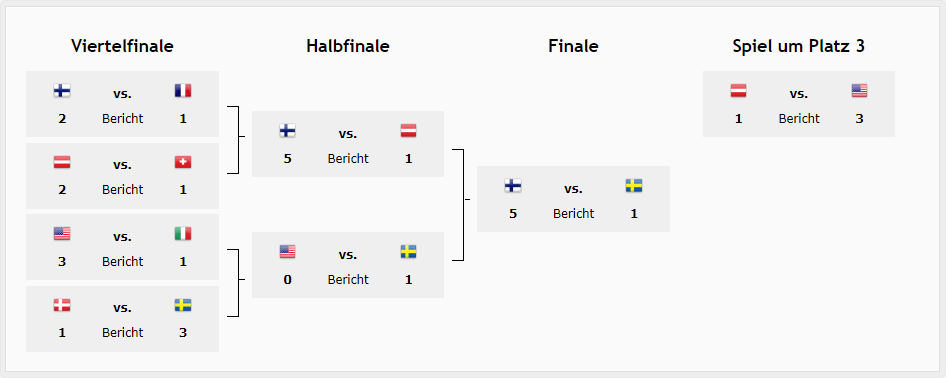
Viertelfinale
| Spieltag | ——–Team 1——– | ——–Team 2——– | Ergebnis | Match ID |
|---|---|---|---|---|
| 16. | Finnland | Frankreich | 2 : 1 | Game Report |
| 16. | Österreich | Schweiz | 2 : 1 | Game Report |
| 16. | USA | Italien | 3 : 1 | Game Report |
| 16. | Dänemark | Schweden | 1 : 3 | Game Report |
Halbfinale
| Spieltag | ——–Team 1——– | ——–Team 2——– | Ergebnis | Match ID |
|---|---|---|---|---|
| 18. | Finnland | Österreich | 5 : 1 | Game Report |
| 18. | USA | Schweden | 0 : 1 | Game Report |
Spiel um Platz 3
| Spieltag | ——–Team 1——– | ——–Team 2——– | Ergebnis | Match ID |
|---|---|---|---|---|
| 20. | Österreich | USA | 1 : 3 | Game Report |
Finale
| Spieltag | ——–Team 1——– | ——–Team 2——– | Ergebnis | Match ID |
|---|---|---|---|---|
| 21. | Finnland | Schweden | 5 : 1 | Game Report |
Play Off Baum
Platzierungsspiele
Platzierungsspiel Vorspiel Platz 5
| Spieltag | ——–Team 1——– | ——–Team 2——– | Ergebnis | Match ID |
|---|---|---|---|---|
| 17. | Frankreich | Dänemark | 2 : 3 | Game Report |
| 17. | Schweiz | Italien | 2 : 3 | Game Report |
Platzierungsspiel Platz 5
| Spieltag | ——–Team 1——– | ——–Team 2——– | Ergebnis | Match ID |
|---|---|---|---|---|
| 19. | Dänemark | Italien | 1 : 2 | Game Report |
Platzierungsspiel Platz 7
| Spieltag | ——–Team 1——– | ——–Team 2——– | Ergebnis | Match ID |
|---|---|---|---|---|
| 19. | Frankreich | Schweiz | 1 : 3 | Game Report |
Platzierungsspiel Platz 9
| Spieltag | ——–Team 1——– | ——–Team 2——– | Ergebnis | Match ID |
|---|---|---|---|---|
| 15. | Norwegen | Estland | 1 : 3 | Game Report |
Platzierungsspiel Platz 11
| Spieltag | ——–Team 1——– | ——–Team 2——– | Ergebnis | Match ID |
|---|---|---|---|---|
| 15. | Deutschland | Kanada | 2 : 1 | Game Report |
Platzierungsspiel Platz 13
| Spieltag | ——–Team 1——– | ——–Team 2——– | Ergebnis | Match ID |
|---|---|---|---|---|
| 15. | Ukraine | Russland | 3 : 2 OT | Game Report |
Platzierungsspiel Platz 15
| Spieltag | ——–Team 1——– | ——–Team 2——– | Ergebnis | Match ID |
|---|---|---|---|---|
| 15. | Slowakei | Großbritannien | 1 : 2 | Game Report |
Allgemeine Werte
Top Team nach Markwert
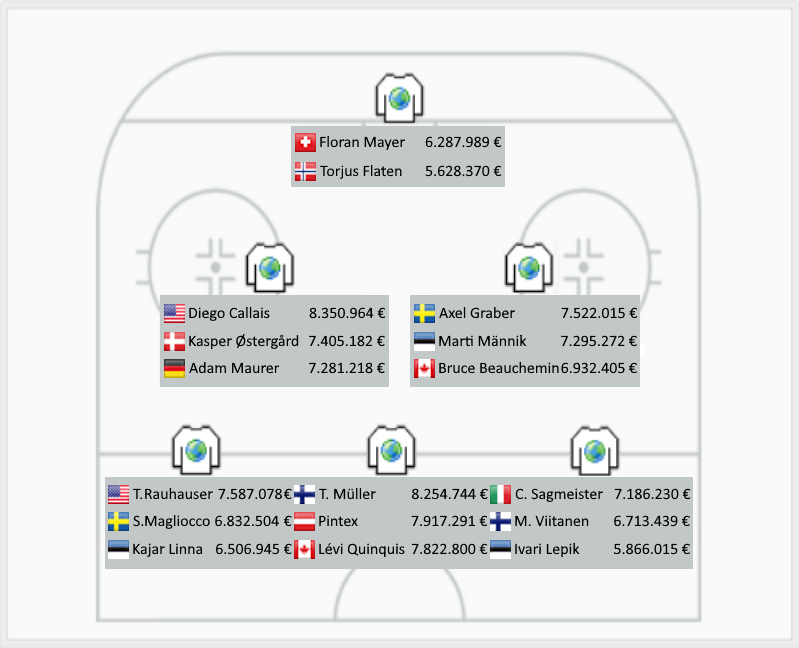
Team Werte
| Pos | Nation | Alter | Nation | Stärke | Nation | Erf. | Nation | SEF | Nation | Wert | ||||
|---|---|---|---|---|---|---|---|---|---|---|---|---|---|---|
| 1. | | 29,0 | | 94,7 | | 83,0 | | 92,8 | | 90.914.452 € | ||||
| 2. | | 29,4 | | 93,8 | | 82,8 | | 92,1 | | 87.590.914 € | ||||
| 3. | | 29,4 | | 93,0 | | 82,8 | | 91,3 | | 86.833.411 € | ||||
| 4. | | 29,5 | | 92,9 | | 82,3 | | 91,3 | | 86.268.673 € | ||||
| 5. | | 29,6 | | 91,5 | | 81,9 | | 90,8 | | 85.066.119 € | ||||
| 6. | | 29,6 | | 91,5 | | 81,6 | | 90,6 | | 84.374.588 € | ||||
| 7. | | 29,8 | | 90,9 | | 81,6 | | 89,9 | | 82.165.855 € | ||||
| 8. | | 29,8 | | 90,0 | | 80,8 | | 89,7 | | 77.999.011 € | ||||
| 9. | | 30,0 | | 88,8 | | 80,5 | | 88,8 | | 76.527.685 € | ||||
| 10. | | 30,1 | | 88,1 | | 80,1 | | 88,6 | | 76.133.580 € | ||||
| 11. | | 30,2 | | 88,0 | | 79,2 | | 88,4 | | 74.307.189 € | ||||
| 12. | | 30,2 | | 87,7 | | 79,1 | | 88,1 | | 72.505.420 € | ||||
| 13. | | 30,2 | | 86,7 | | 78,8 | | 87,1 | | 72.117.114 € | ||||
| 14. | | 30,3 | | 86,6 | | 78,2 | | 86,4 | | 70.293.565 € | ||||
| 15. | | 30,4 | | 85,6 | | 76,9 | | 86,1 | | 69.883.708 € | ||||
| 16. | | 30,5 | | 84,3 | | 75,5 | | 85,8 | | 67.366.085 € | ||||
| ø | 4.633.630 € | |||||||||||||
| Gesamt | 1.260.347.369 € |